Simulations of one-sided statistical tests in R
This page contains codes for the R project software which simulate and demonstrate the validity of one-sided tests.
Effect of predictions on the type I error of one-sided tests
In this simulation you can observe the irrelevance of any kind of predictions on the outome of one-sided tests. You can alter alpha to set the significance threshold and alter predictEffect to make a different prediction ("greater" by default).
By default the code will execute for the worst-case scenario for both tests: a true effect of zero and will demonstrate that the error rate is preserved regardless of your prediction.
sims <- 100000 # number of simulations to perform

p <-numeric(sims)

x <-numeric(sims)

y <-numeric(sims)

predictEffect <- "greater"; # "greater" or "less"

trueEffect <- 0; # 0 for no effect, negative or positive numbers for less or greater true effect

mean1 <- 100;

alpha <- 0.05; # significance threshold

for(i in 1:sims)

{

  x[i]<-list(rnorm(n = 100, mean = mean1 + trueEffect, sd = 20));

  y[i]<-list(rnorm(n = 100, mean = mean1, sd = 20));

}

#perform left-sided test

for (i in 1:sims)

{

  z<-t.test(x[[i]],y[[i]],alternative="greater");

  p[i]<-z$p.value;

}

cat("target error rate:", alpha, "\n");

cat("observed error rate:", sum(p < alpha)/sims, "\n");

#perform right-sided test
for (i in 1:sims)
{

  z<-t.test(x[[i]],y[[i]],alternative="less");

  p[i]<-z$p.value;

}

cat("target error rate:", alpha, "\n");

cat("observed error rate:", sum(p < alpha)/sims, "\n");
As a cursory inspection of the code will reveal, the predictEffect variable is not used in the simulation at all, clearly showing that it has zero relevance to the validity of the two one-sided tests. Note that same goes for the moment when you choose your acceptable risk, α. This is usually done beforehand to secure support and commitment from stakeholders, but no statistical issues arise from setting it afterwards.
If you alter trueEffect then the observed rates represent the statistical power of the test for the given true effect. With the default value of zero, power equals alpha (POW(T(α); μ1 = 0) = α).
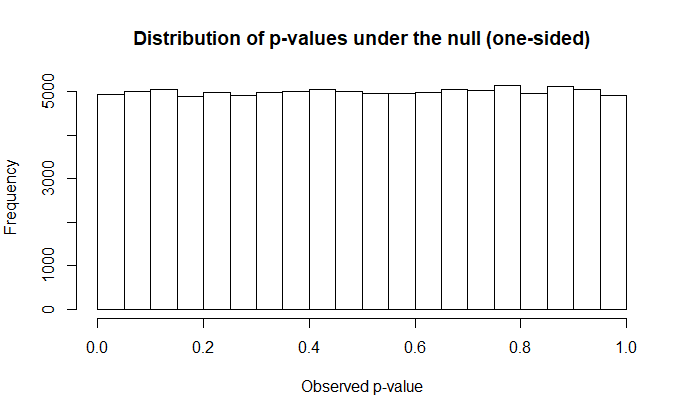
P-value distribution under the null
This simulation generates random numbers from two populations with normally-distributed error under the worst possible scenario: a true difference of zero. A one-sided and then a two-sided test is performed on the generated numbers. Both calculations will produce approximately the same distribution of p-values under their respective nulls, demonstrating that the probabilities reported by both tests hold equally versus their respective null hypotheses.
alpha <- 0.05; # significance threshold;

sims <- 100000; # number of simulations to perform

p1 <-numeric(sims); # to hold p-values of one-sided tests

p2 <-numeric(sims); # to hold p-values of two-sided tests

for(i in 1:sims){

  x<-rnorm(n = 100, mean = 100, sd = 20);

  y<-rnorm(n = 100, mean = 100, sd = 20);

  z<-t.test(x,y,alternative="greater");

  p1[i]<-z$p.value;

  z<-t.test(x,y);

  p2[i]<-z$p.value;

}

cat("target error rate (one-sided):", alpha, "\n");

cat("observed error rate (one-sided):", sum(p1 < alpha)/sims, "\n");

cat("observed error rate (two-sided):", sum(p2 < alpha)/sims, "\n");

hist(p1, main="Distribution of p-values under the null (one-sided)", xlab=("Observed p-value"));

hist(p2, main="Distribution of p-values under the null (two-sided)", xlab=("Observed p-value"));
The target and observed error rates of the one-tailed and two-tailed tests are reported as well. The histograms of the p-value distribution should look like so: